Multiparadigm Data Science
Multiparadigm Data Science is a new approach of using AI and modern analytical techniques, automation and human-data interfaces to arrive at better answers with flexibility and scale.
Many organizations are still doing traditional data science—confining themselves to problems that are answerable with traditional statistical methods—rather than utilizing the broad range of interfaces and techniques available today. Whether it's automated machine learning, interactive notebooks and report generation, natural language queries of data for instant visualizations or implementing neural networks with ease and efficiency, modern problem solving requires access to the right technology at every stage.
With a flexible, integrated multiparadigm workflow, problems too complex for traditional methods can get real, quantifiable answers.

Examples of Multiparadigm Data Science


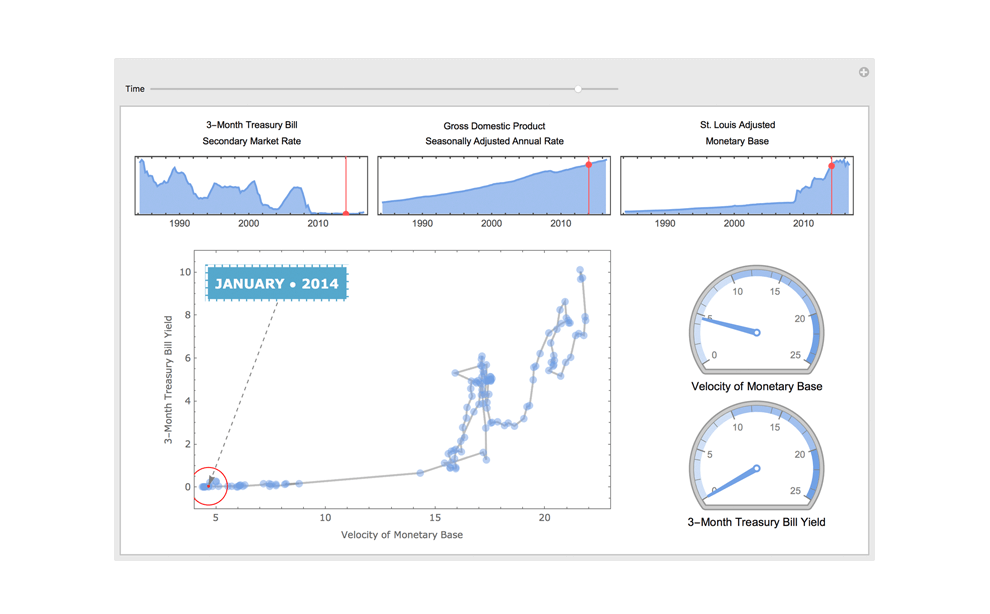
My trading dashboards run on real-time data connections, high-precision computation and detailed charts. And since it's all in a cloud-based multiparadigm system, I can access it from anywhere for quick decisions.
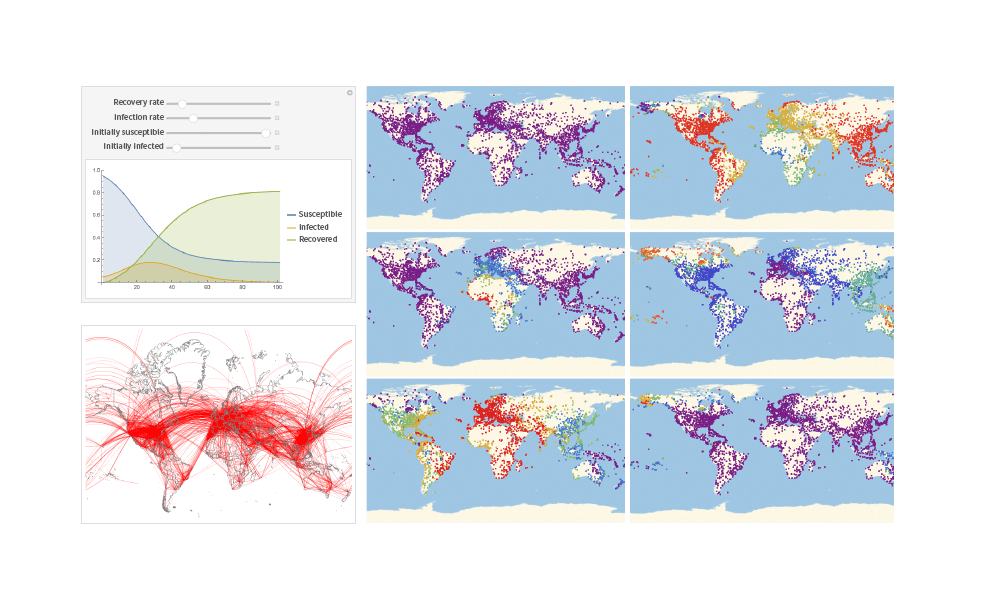
To study the spread of the epidemic, we had to wrangle information from a variety of fields and sources, running several large-scale simulations. Our multiparadigm system let us consolidate the data quickly and adjust our models in real time for faster, more effective analysis.
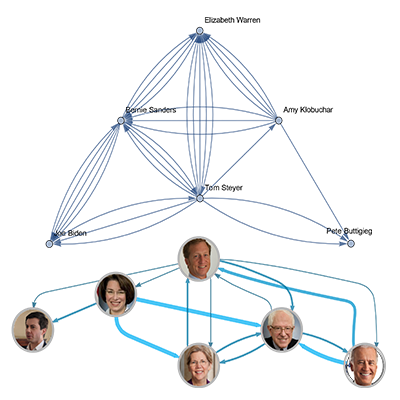
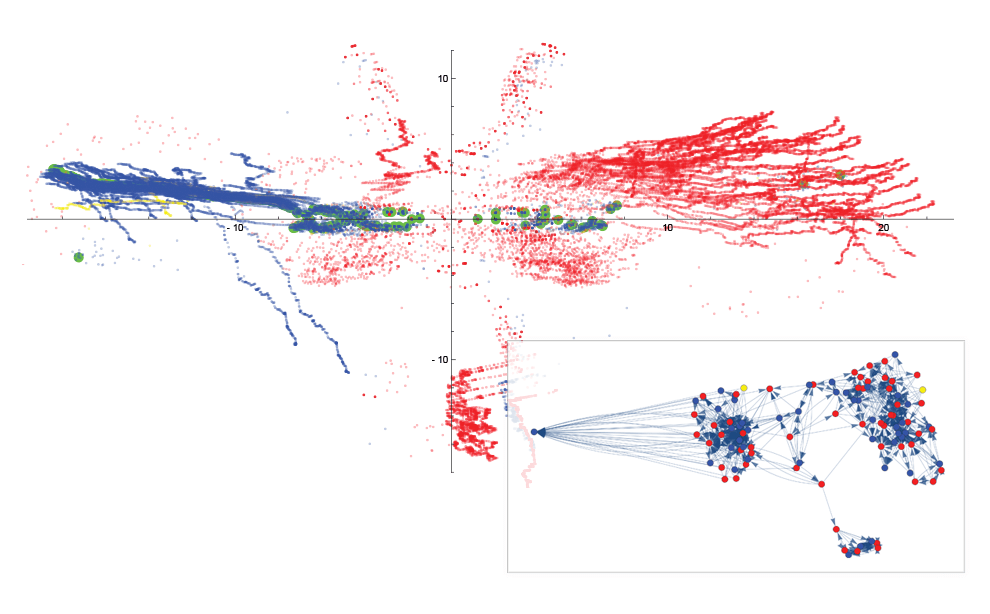
To examine political partisanship in the US Senate, we sorted through multidimensional data and tried analytic techniques from a variety of fields. The multiparadigm approach let us discover patterns we otherwise wouldn't have seen.
My run data automatically goes from my device to the cloud, where I can immediately compute on it, connect it to other data and visualize it in all kinds of unexpected ways. The multiparadigm approach allowed me to answer questions I didn't even know I had.
Importing data from curated service connections, our intuitive interface lets us explore data without a lot of programming or math. We used the multiparadigm approach to make complex data look interesting—and discovered some unique insights along the way.
Interfacing with Your Data
Having the right interface to get answers from data is crucial; different interfaces are suited to different tasks. A multiparadigm system combines a broad range of intuitive options for interacting with data every step of the way.

Interactive NotebooksStreamline your daily workflow using high-level notebook documents that combine text, images, code and interactive examples—editable and runnable on any platform for fast, easy collaboration. |

Natural LanguageQuery your data instantly with natural language and get conversational answers for an intuitive, low-effort process that leads to more insights and better decisions. |
|

Triggered ReportingAutomatically receive alerts and updated reports based on custom criteria, tracking trends in real time for critically timed decisions. |

Presentations with Live ModelingRun your meetings interactively, adjusting parameters to compute instant what-if scenarios for deeper discussions and stronger results. |
|

Programmatic AccessStore your models as platform-independent packages and APIs, providing a centralized framework for computation and automation to power human-data interfaces across your enterprise |

Classic Interfaces with Modern IntegrationSeamlessly connect existing spreadsheets, databases and applications into higher-level computation, stepping up speed and accuracy with additional back end power. |
Know Your Data Science Areas
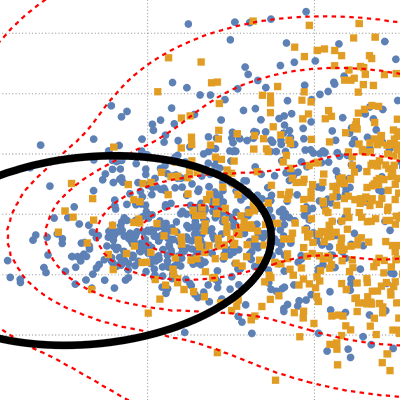
The field of data science is constantly growing and changing. A multiparadigm workflow requires a broad algorithmic toolkit with the full suite of processing, analysis and visualization for ever-increasing computational needs.
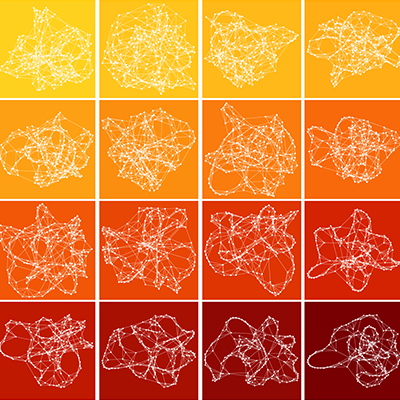
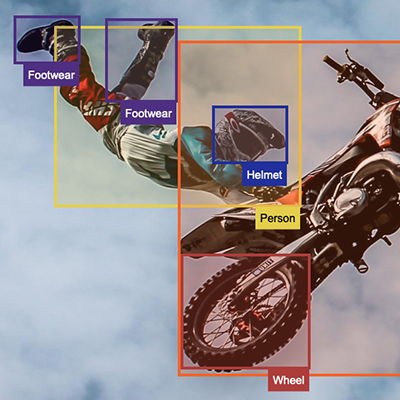
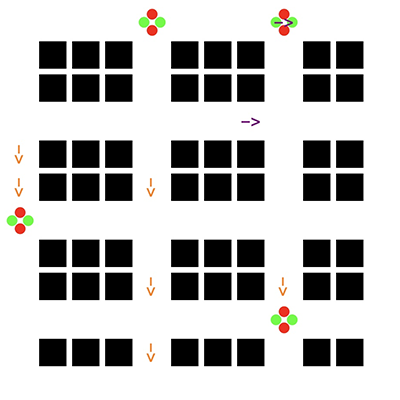
Neural NetworksCreate and train layered processing networks for deep analysis and processing tasks, such as recognizing defective items coming off a production line. |
![]() Show All (15 more)
Show All (15 more)
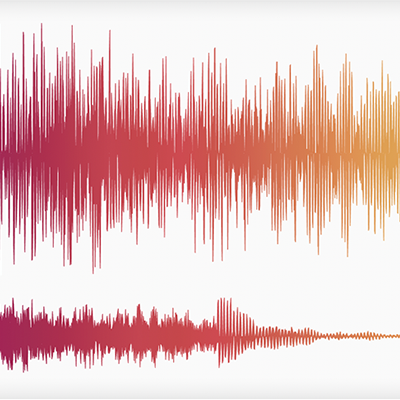
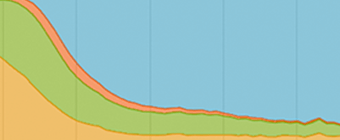
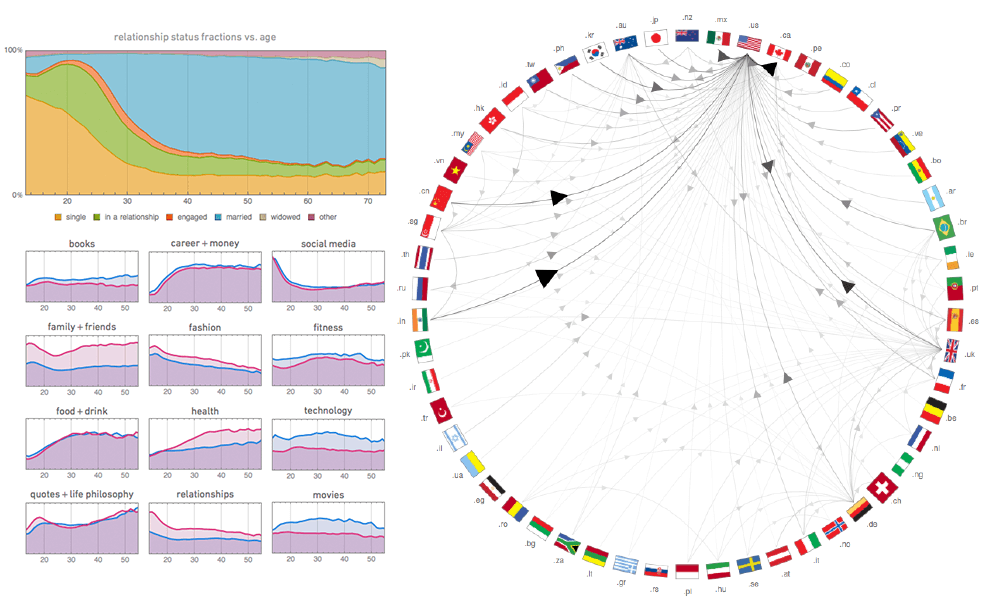
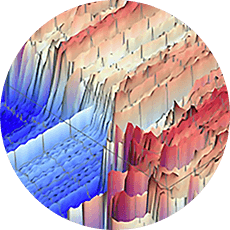
Dynamic VisualizationDisplay data in styled plots, charts and infographics, making it human-readable and interactive for quick analysis and decision making. Tech for dynamic visualization Examples using dynamic visualization Reddit DataViz Battle JAN2018: Visualize the Growth Rates of Algae The Voters Have Spoken—But What Did They Say? (Part 2) Temperature in Champaign, IL, from 1973–2017—Visualization The Global Terrorism Database (GTD) |
||
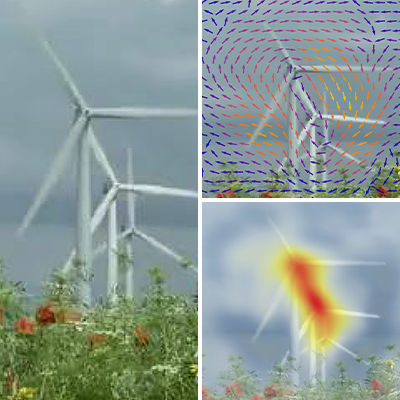
Systems ModelingModel physical, electrical and other systems to inform design decisions, like the most effective heating installation for a building. |
||
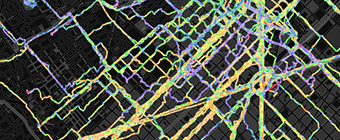
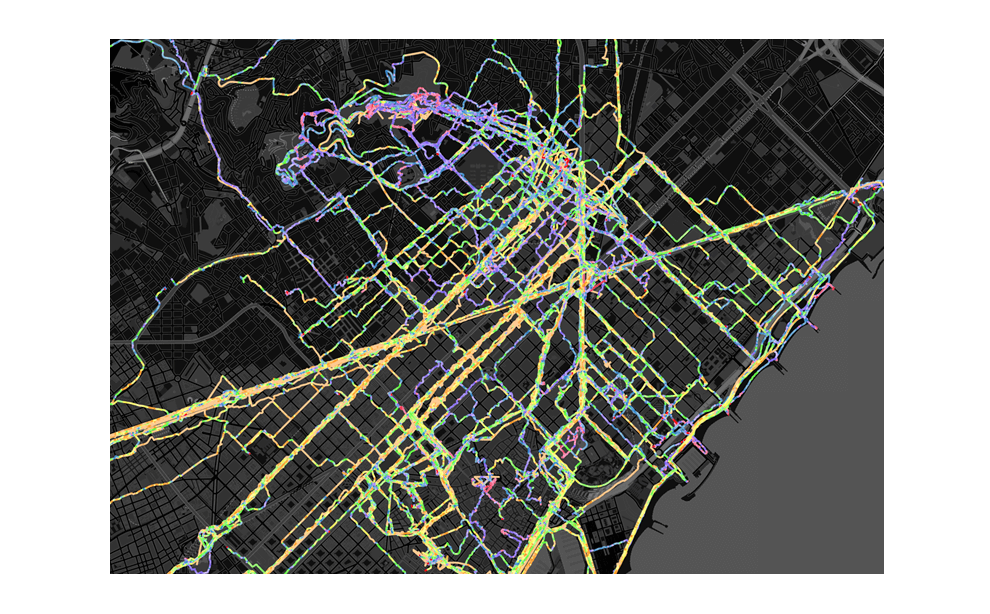
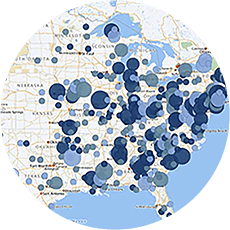
GeocomputationUse precise geolocation data and powerful geodetic computations to accurately examine real-world situations, such as visualizing optimal routes for a bus service. |
![]() Show Less
Show Less

Thirty years of building the ultimate computation environment make the Wolfram technology stack ideal for Multiparadigm Data Science (MPDS)—a multitude of interfaces, language types, computational approaches and ready-to-use data all woven into one ecosystem.
A multiparadigm approach requires a broad, flexible computational toolkit that incorporates all aspects of a project into one start-to-finish workflow. The Wolfram technology stack does exactly this, enabling you to take data from hundreds of formats, carry out a full spectrum of analysis and visualization and immediately share or publish your results—all using the world's largest collection of algorithms and computable knowledge.
MPDS with the Wolfram Language
Hear from the Practitioners
Optimizing Supply Chains with Business Laboratory
In addition to bringing speed, power and flexibility to each of Business Laboratory's simulations—from airline routes and supply chains to flu pandemics and business processes—the Wolfram Language offers integration with many data sources to help quickly build prototypes, significantly enhancing profitability for their clients. President George Danner calls it "the perfect environment for doing serious work in technical computing." Read more »

Business Intelligence with Pronto Analytics
Ariel Sepúlveda, founder of Pronto Analytics, chose the Wolfram Language to solve the business intelligence, data mining and analytics needs of his clients because "combining the speed, the power, the set of functions you have available for programming, what you get is an amazing toolbox that is hard to find anywhere else." Read more »
Intelligent Retail Management with St. Marche Supermarkets
"We have a lot of data about our customers... where they live, how far they are from our stores," says Rodrigo Murta, Manager of Retail Intelligence for St. Marche. With the power and speed of the Wolfram Language, his "Swiss Army Knife" for computation, Murta turns seemingly random customer data into invaluable information—using it to establish rules to control pricing for tens of thousands of units, keep a close eye on profits and report back to investors. Read more »

Energy Analytics with Agilis Energy
Agilis Energy begins with imported smart meter data and the Wolfram Language's built-in WeatherData, then applies sophisticated statistics and visualization functionality to generate what CEO Joseph Hirl calls an "MRI of a building," a dynamic interface with a simulation of the building's energy use and demand, along with forecasting tools. Read more »